Light gray square, with a dark gray border on the sides.

Blog

The Borderline Case You Can't Afford to Get Wrong: How Advanced Plaque Analysis Changes the Clinical Calculus

May 19, 2026

Part 1 of 5 in Circle's Coronary Plaque series.

Consider a familiar scenario. A 52-year-old presents with atypical chest discomfort. The stress test is borderline. The referring physician is uncertain — is this true coronary disease, or something else? Standard imaging has been done. The anatomy looks, on the surface, mostly normal. And yet something about this patient doesn't sit right.


This is the case where clinicians have historically had to make consequential decisions with incomplete information. Escalate to invasive angiography and risk an unnecessary procedure. De-escalate and risk missing a vulnerable plaque that hasn't yet caused significant stenosis — but will.


Coronary artery disease doesn't announce itself neatly. A substantial share of acute coronary events occur in patients with non-obstructive coronary disease — lesions that would not have triggered revascularization on a standard angiogram. The stenosis grade has always been an imperfect surrogate for risk. What matters is the plaque itself: its composition, its burden, and its vulnerability.


Advanced CCTA plaque analysis changes that calculus.

Beyond Stenosis: What Plaque Characterization Actually Tells You


Coronary CT angiography is already the most guideline-supported non-invasive modality for evaluating stable chest pain. The 2021 ACC/AHA Chest Pain Guidelines elevated CCTA to a Class I recommendation for initial evaluation — a reflection of trial data from SCOT-HEART and PROMISE showing superior diagnostic accuracy and meaningfully better downstream outcomes.


But standard CCTA reporting stops at stenosis. The next frontier is what the plaque looks like — and that requires dedicated post-processing analysis.


High-risk plaque features identified on CCTA carry independent prognostic weight:


  • Low-attenuation plaque (LAP): Lipid-rich necrotic core content associated with plaque vulnerability
  • Positive remodeling: Outward arterial expansion that masks stenosis severity while indicating active plaque development
  • Spotty calcification: Small, isolated calcium deposits correlated with plaque instability
  • Pericoronary adipose tissue (PCAT): A marker of coronary inflammation detectable on standard CCTA datasets


The PARADIGM registry, one of the largest longitudinal CCTA studies, demonstrated that whole-heart plaque burden and progression — not just stenosis — independently predict major adverse cardiovascular events. More recently, 10-year outcomes from SCOT-HEART showed a sustained reduction in coronary heart disease death and non-fatal MI in patients managed with CCTA-guided care, and the ongoing SCOT-HEART 2 trial is now testing CCTA as a primary-prevention screening tool against standard risk scoring.


This is not an emerging research concept. It is becoming a clinical standard — and the gap between sites that can do it and sites that can't is widening.


The Diagnostic Confidence Problem


The challenge for most programs isn't awareness. Cardiologists and radiologists increasingly understand what plaque analysis offers. The challenge is access: most CCTA reporting workflows were built for stenosis assessment and were never designed to support quantitative plaque characterization.


Manual plaque analysis is time-consuming and prone to inter-observer variability. Dedicated standalone tools require separate logins, separate data pipelines, and a workflow that doesn't integrate cleanly with the reading environment clinicians already use. The result is that plaque characterization gets done inconsistently — on selected cases, by certain readers, when time permits.


That inconsistency has consequences. It means the same patient might receive a comprehensive plaque report at one visit and a stenosis-only report at the next. It means risk stratification quality varies by reader and by shift. And it means that the borderline case — the 52-year-old with atypical symptoms and a mostly normal scan — may not get the full picture needed to make a confident call.


What Changes When Plaque Analysis Is Built Into the Workflow


cvi42 integrates CCTA plaque analysis natively within the same post-processing environment used for cardiac MRI, CT function, and structural heart assessment. The result is a materially different clinical experience.


Quantitative plaque metrics — total plaque volume, LAP volume, percent atheroma volume, high-risk plaque feature scoring — are generated within the same workspace where the clinician reviews anatomy, function, and prior studies. There is no separate login, no data export, no switching between applications. The plaque data is part of the report, not appended to it afterward.


For the borderline case, that integration matters. A cardiologist reviewing a CCTA can see, in a single view, that a lesion with 40% stenosis also carries high LAP burden — changing the risk interpretation and supporting a more aggressive preventive management decision. Or the reverse: a case that looks alarming on anatomy shows low-burden, calcified, stable plaque — supporting confident de-escalation and a clear patient conversation.


This is the kind of nuanced, evidence-based characterization that current ACC/AHA prevention guidelines call for. cvi42 makes it achievable in standard clinical workflow, not just in research centers.


From Uncertainty to a Defensible Decision


There is also a medicolegal dimension to this conversation that cardiologists and radiologists are increasingly aware of. Missed plaque diagnoses — particularly in patients who subsequently present with acute coronary syndrome — are among the most scrutinized claims in cardiovascular imaging litigation. A reporting workflow that produces only stenosis data, when AI-assisted plaque characterization was available and guideline-supported, is increasingly difficult to defend.


The standard of care is moving. Adopting a platform that supports guideline-concordant plaque analysis is not just a clinical choice — it is a professional risk management decision.


Putting It Together


Advanced coronary plaque analysis represents one of the most significant advances in non-invasive cardiovascular imaging in the past decade. The clinical evidence is mature. The guidelines are aligned. The technology to do it efficiently, in standard workflow, now exists.


The 52-year-old with the borderline stress test and the atypical symptoms deserves more than a stenosis grade. With cvi42, you have the plaque insights to tell the full story — and the confidence to act on it.


Book a cvi42 demo to see coronary plaque analysis  →


Stay tuned for more on Advanced Plaque Analysis from the perspective of IT and PACS administrators, CFOs and finance leadership, imaging lab directors and department heads.

Four people in a modern office meeting around a desk with multiple computer monitors.
June 25, 2026
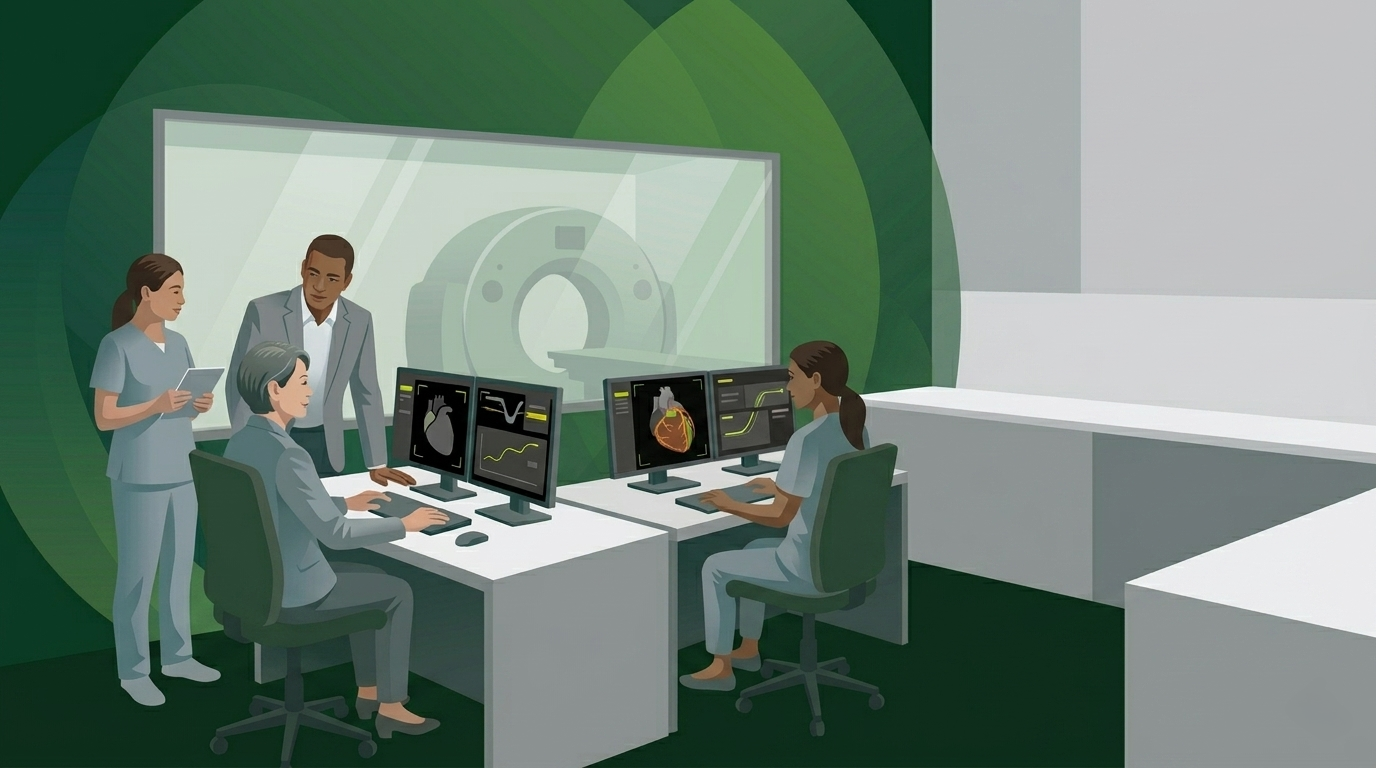
Part 4 of 5 in Circle's Coronary Plaque series. Also read: Part 1 — How Advanced Plaque Analysis Changes the Clinical Calculus Part 2 — The IT Infrastructure Behind CCTA Plaque Analysis Part 3 — The Financial Case for Coronary Plaque Services It's Monday morning review. Throughput is off target again. Two radiologists are working through a backlog of CCTA studies from Friday. Your most experienced cardiac CT tech just submitted a PTO request for a week in July that you can't cover without asking someone else to come in. And now cardiology has sent a note asking why the plaque analysis reports are taking so long. This scenario is not unique to your department. It is the operational reality facing most cardiac imaging programs as CCTA volume grows and clinical expectations evolve faster than workflows do. Coronary plaque analysis has moved from a research capability to a clinical standard — driven by updated ACC/AHA Chest Pain Guidelines , 10-year SCOT-HEART outcomes and the ongoing SCOT-HEART 2 trial , and a growing population of patients and referring physicians who know what to ask for. Meeting that expectation with a manual workflow built for a simpler era of CCTA reporting is not a sustainable operating model. The question is not whether to offer plaque analysis. The question is how to build the workflow to deliver it without adding to a backlog that's already under pressure.
Person in green examines a glowing green sphere beside a white control panel in a green-toned room.
June 16, 2026
Part 3 of 5 in Circle's Coronary Plaque series. Also read: Part 1 — How Advanced Plaque Analysis Changes the Clinical Calculus Part 2 — The IT Infrastructure Behind CCTA Plaque Analysis The cardiology service line is under familiar financial pressure: rising volumes, tighter margins, growing competition from outpatient and independent imaging centers, and a capital environment that demands every major investment justify itself with a clear return. Against that backdrop, coronary plaque analysis has emerged as a meaningful financial opportunity — one with a growing reimbursement pathway, expanding referral demand, and the kind of clinical differentiation that drives patient retention. But the financial case only materializes if the program is set up to deliver the service efficiently and at scale. This is not an investment in a research capability. It is an investment in a billable, guideline-supported clinical service with a documented and growing payer footprint.
June 9, 2026
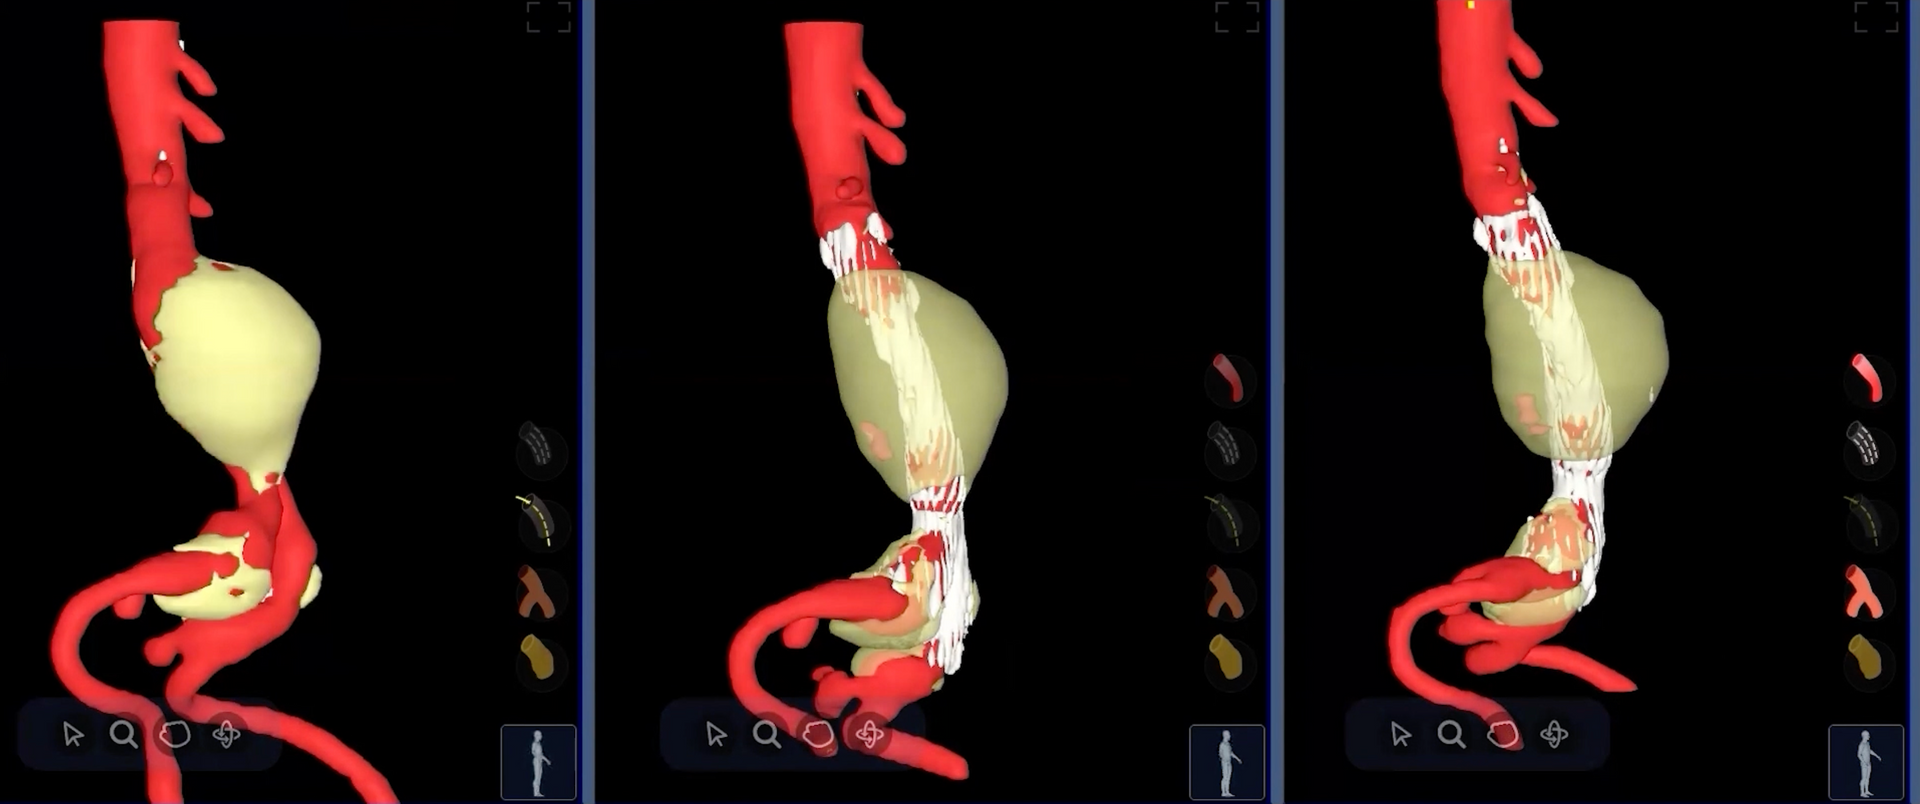
A landmark study shows that measuring how much an aneurysm sac shrinks in the first year after surgery can reliably forecast what that sac's diameter will do over the long haul — unlocking smarter, more personalised patient monitoring. The Problem with Watching Arteries Heal Abdominal aortic aneurysms — dangerous bulges in the body's main artery — kill tens of thousands of people each year when they rupture without warning. Endovascular aneurysm repair, or EVAR , is a minimally invasive surgery in which doctors thread a stent-graft through the groin to seal off the bulge from the inside, like patching a weak hose from within. It's revolutionised vascular surgery, offering patients a far quicker recovery than open surgery. But EVAR is not a cure. The sealed sac still exists inside the body, and over months and years it can change size — ideally shrinking as blood pressure is removed from it, but sometimes stubbornly staying the same or even growing. A sac that keeps expanding after surgery can signal a dangerous leak (called an endoleak ) or graft failure, either of which may require a second intervention. So, after every EVAR procedure, patients face a lifetime of periodic CT scans to check one simple thing: is the sac getting bigger or smaller? "For years, the number clinicians relied on was a single diameter measurement — essentially, how wide is the bulge? But width alone turns out to be a surprisingly blunt instrument." - Background context from the field of post-EVAR surveillance The challenge is that current guidelines require follow-up CT scans roughly every year for life, which is expensive, exposes patients to radiation, and still may miss subtle warning signs until they have become obvious on a simple diameter measurement. Researchers and clinicians have long wondered: is there a better, earlier signal we could use?
June 2, 2026
Part 2 of 5 in Circle's Coronary Plaque series. Also read: Part 1 — How Advanced Plaque Analysis Changes the Clinical Calculus When clinical cardiology adopts a new capability, IT inherits the infrastructure. And right now, coronary plaque analysis is moving from research tool to clinical standard fast enough that many IT and PACS teams are still catching up. The demand is real. The 2021 ACC/AHA Chest Pain Guidelines made CCTA a Class I recommendation for stable chest pain evaluation. More recent trial data — including 10-year outcomes from SCOT-HEART and the ongoing SCOT-HEART 2 trial — is driving cardiology programs to go further, adding quantitative plaque characterization alongside standard stenosis reporting. That means new software, new data flows, new integrations — and new complexity landing in your environment. How that complexity lands depends almost entirely on the path the department chooses. There are essentially two: a unified platform that performs plaque analysis natively, inside your existing environment — or a send-away service that moves CCTA data out of your network to a vendor cloud, runs the analysis there, and returns a result. Those two paths lead to very different IT outcomes.

Subscribe to our newsletter

 Don’t miss future articles or publications.